Aaron Rodgers: A Statistical Analysis
Aaron Rodgers is arguably the best quarterback in the NFL. He has all of the accolades that cement him as a first ballot Hall of Famer and possibly, the Greatest of All Time. However, there is one stat holding him back: his single Super Bowl victory. In his defense, Aaron hasn't had a top ten defense since the 2010 Super Bowl run.
Despite the lack of playoff success, Aaron carries the Packers each season. Every year, analysts predict massive success behind Aaron's arm, but the success never comes to fruition until the midpoint of the season when the Packer's are undoubtedly at risk of missing the playoffs.
I took a look at Aaron's stats from the past five seasons and compiled them into a spreadsheet to analyze if exactly he does perform better in the second half of the season.

After compiling his season stats, I found the box score for each game over the past five seasons and divided his season performance into two halves, eight games each (except in 2017, due to injury, and 2018, as the season is still in progress).


With all of the stats compiled, I made a mock-up info-graphic, specifically of Aaron's 2016 campaign.
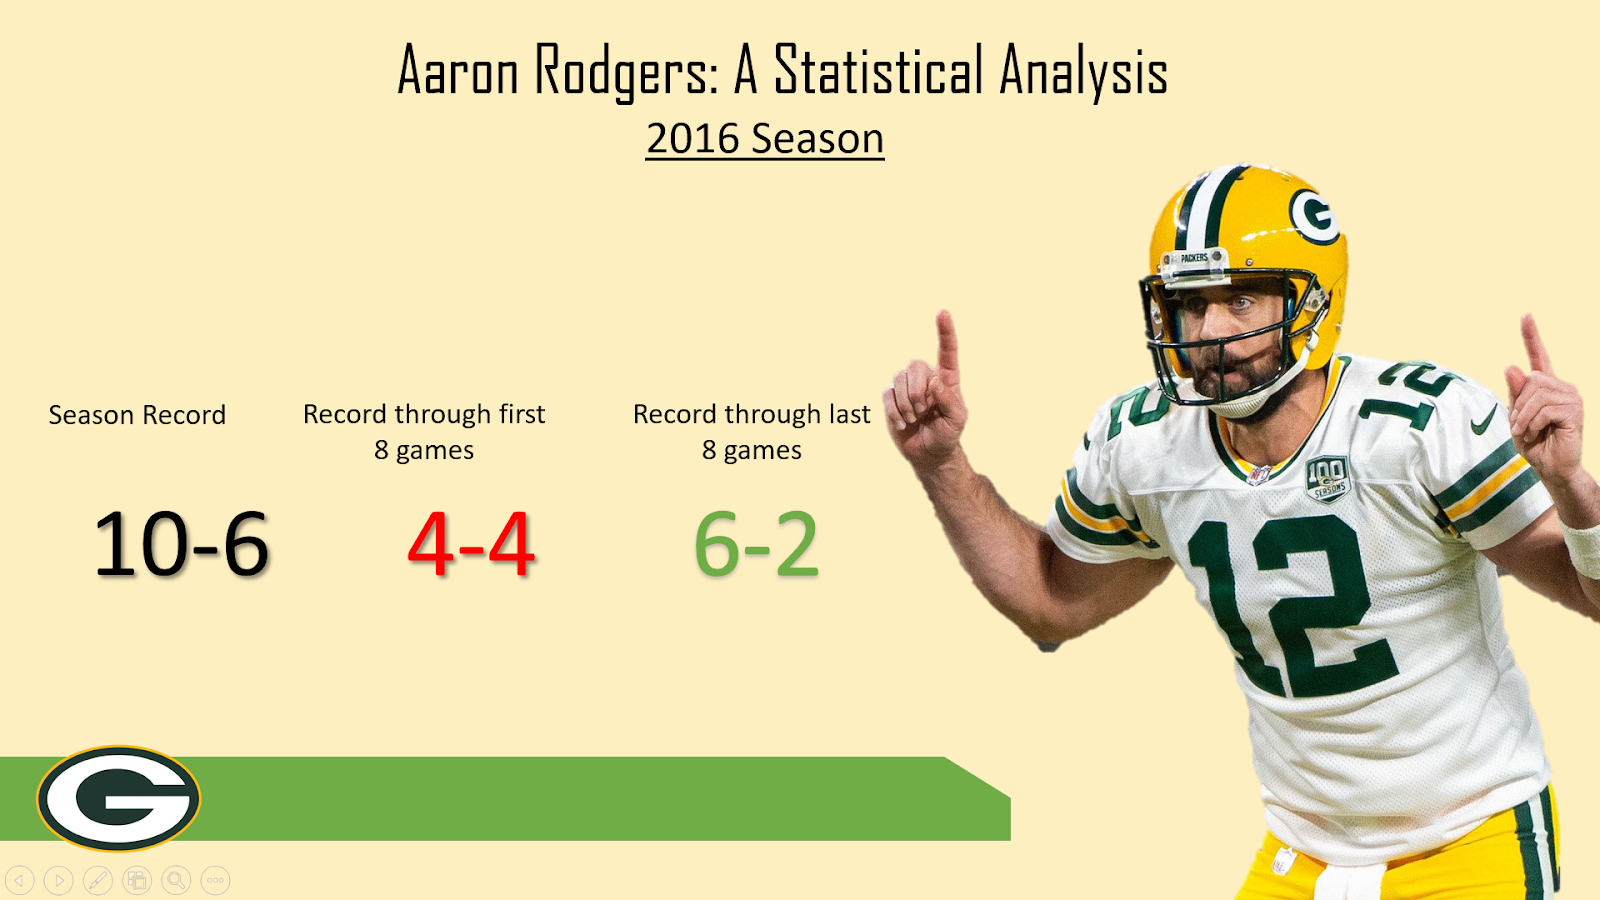
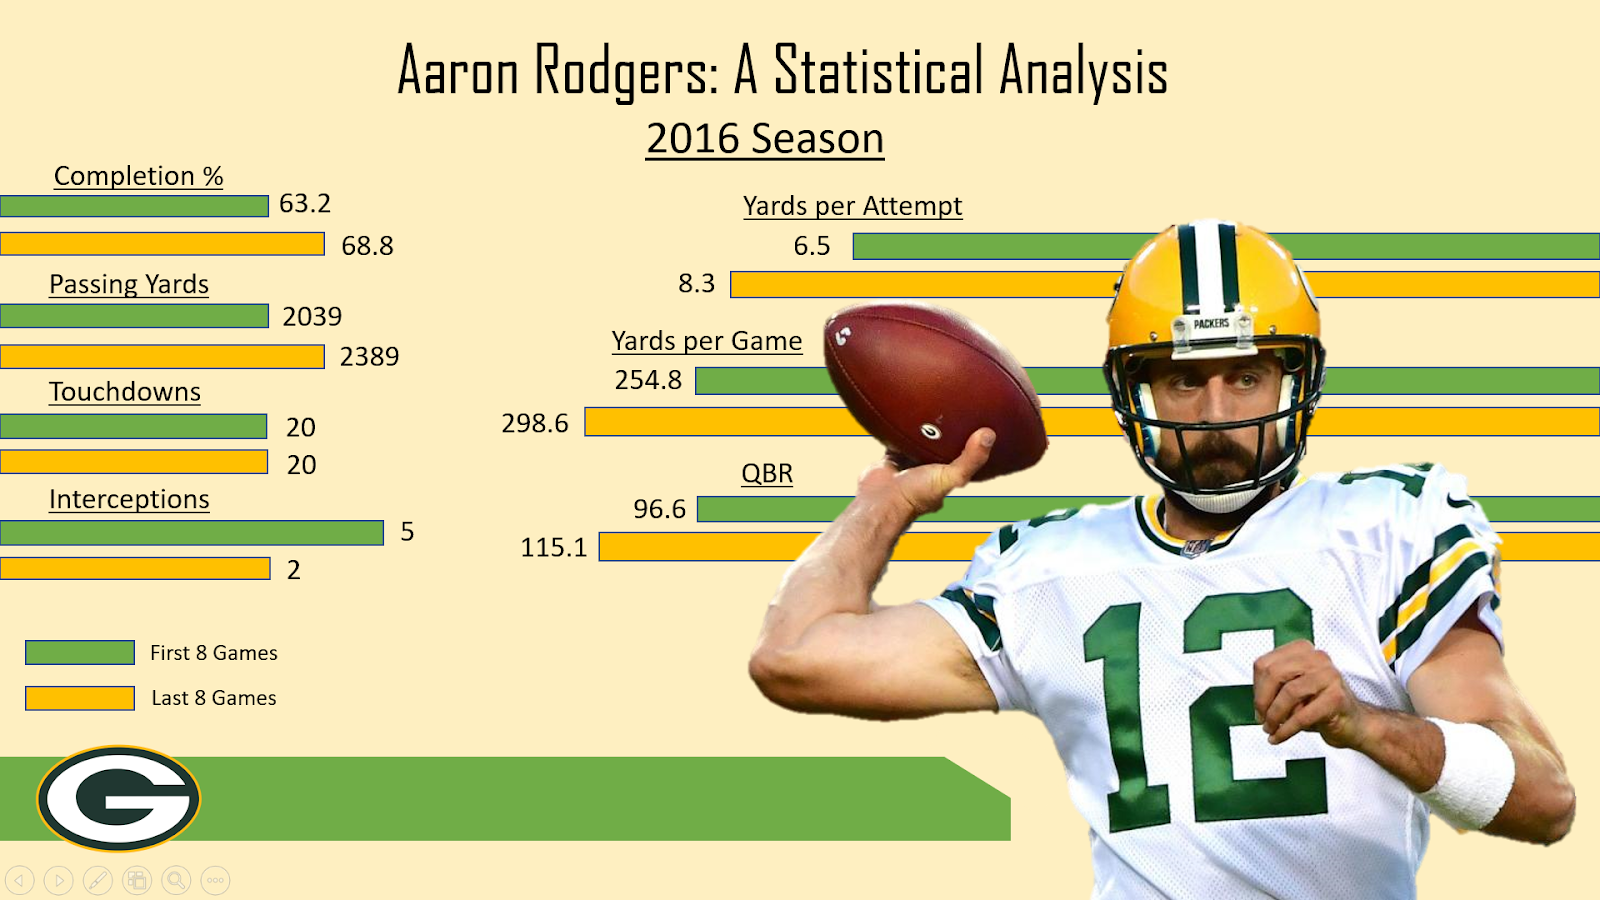
Upon examination, it would appear the Rodgers does perform better in the second half of the season, if that season occurs in an even year. In 2014 and 2016, Aaron shifted his performance in the second half and produced elite stats. In 2015 and 2017, Aaron actually performed worse in the second half of the season, and things aren't looking up for 2018.
Sources:
http://www.espn.com/nfl/player/gamelog/_/id/8439
https://www.pro-football-reference.com/players/R/RodgAa00.htm
https://www.pro-football-reference.com/teams/gnb/
Sources:
http://www.espn.com/nfl/player/gamelog/_/id/8439
https://www.pro-football-reference.com/players/R/RodgAa00.htm
https://www.pro-football-reference.com/teams/gnb/